


Assessment
Accreditation
The University of Alaska Anchorage Department of Human Services is accredited by the Council for Standards in Human Service Education (CSHSE) for both of its Associate of Applied Science in Human Services (AAS) and Bachelor of Human Services (BHS) degree programs.
Student Achievement Indicators
The following information describes the student population of human services majors, including student achievement and academic performance indicators for degree programs offered by the Department of Human Services at UAA. Information includes data from all UAA campus locations (Anchorage campus, Mat-Su College campus, and Kenai Peninsula College campus) for the 2018 - 2022 academic years and was compiled from Public Dashboard reports provided by the Office of Institutional Research (IR) at UAA.
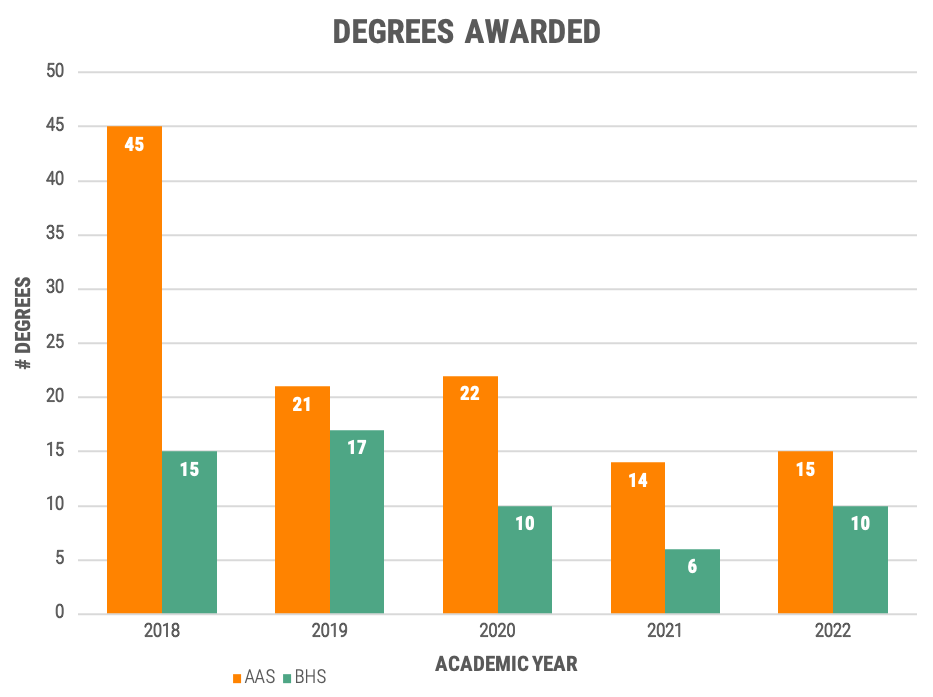
Degrees Awarded
The following chart shows the number of human services degrees that were awarded for the Associate of Applied Science in Human Services (AAS) and Bachelor of Human Services (BHS) degrees for the 2018 - 2022 academic years (AYs). For the 2018 AY, 45 AAS and 15 BHS degrees were awarded. For the 2019 AY, 21 AAS and 17 BHS degrees were awarded. For the 2020 AY, 22 AAS and 10 BHS degrees were awarded. For the 2021 AY, 14 AAS and 6 BHS degrees were awarded. For the 2022 AY, 14 AAS and 10 BHS degrees were awarded.
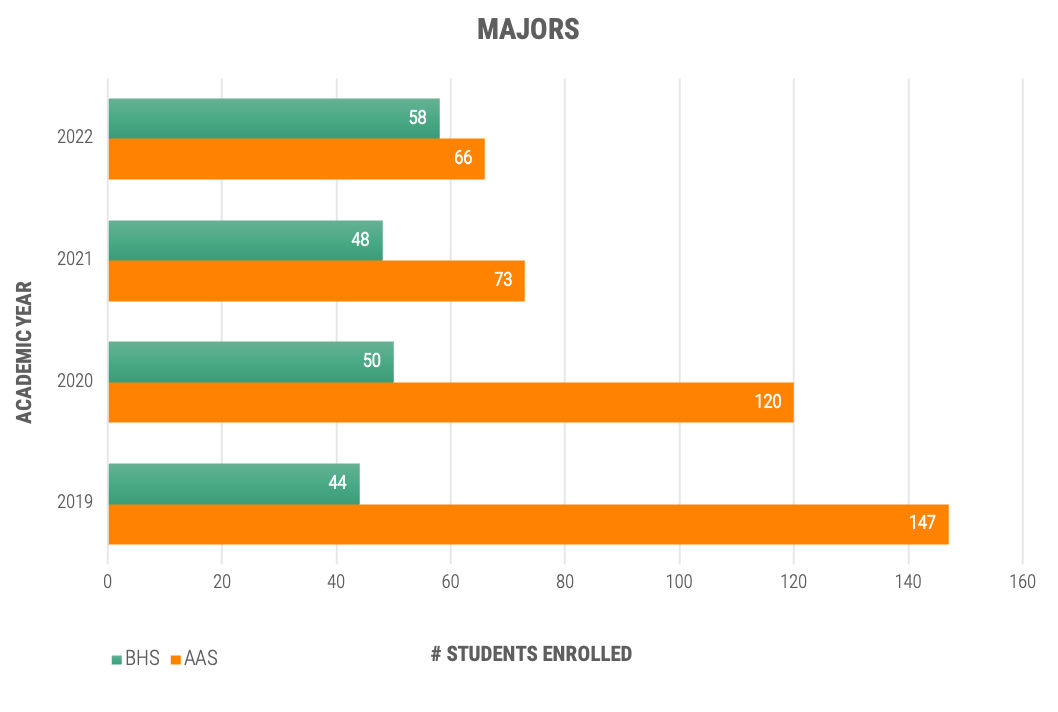
Majors
The following chart shows how many associate and bachelor's majoring in human services (HUMS) were enrolled in the program for the 2019 to 2022 academic years (AY). For the 2019 AY, 147 Associate of Applied Science (AAS) and 44 Bachelor of Human Services (BHS) students were declared as HUMS majors. For the 2020 AY, 120 AAS and 50 BHS students were declared as HUMS majors. For the 2021 AY, 73 AAS and 48 BHS students were declared as HUMS majors. For the 2022 AY, 66 AAS and 58 BHS students were declared as HUMS majors.